Table of Contents
** Minutes
Ad data from 20+ e-commerce brands and millions of dollars in spend
How do major ecommerce brands grow so quickly?
After analising well-known brands, as well as many smaller but rapidly scaling companies, we found that there’s one marketing channel that grows ecommerce brands faster than any other.
And if you aren’t using it to its full potential, you’re hindering the potential growth of your company.
It’s not:
- SEO
- PR
- Influencer marketing
- Email marketing
- Affiliates
The one channel that’s creating more growth for e-commerce brands than any other is Facebook ads.
Here are a few reasons why Facebook advertising is so exciting for ecommerce:
- Product discovery: Unlike Google Search ads, which require a user to be specifically looking for a product like yours, Facebook allows your brand to get in front of potential customers who may not even be aware that a product like yours exists.
- Targeting: Facebook has the most sophisticated targeting capabilities of any ad platform online. It enables advertisers to target consumers by their age, location, sex, marital status, and interests, such as the movies, music, magazines, and brands they like and follow.
- Visual: Facebook is an extremely visual ad platform. This allows e-commerce brands to show off engaging images and videos of their products.
- Transparent reporting: With Facebook, it’s very easy to track how much revenue you’re getting from your campaigns. Unlike other forms of advertising which are not as easily tracked, with Facebook, you can see the impact of your campaigns down to the penny.
- Scale: You’d be shocked by the number of e-commerce brands you’ve never heard of that are (profitably) spending $100,000 each month on Facebook ads. How do such small brands have such large ad budgets? Because when Facebook works, it can be extremely scalable.
Facebook ads offer a lot of exciting opportunities for ecommerce brands. But if you’re new to Facebook ads, it can seem scary, confusing, and overwhelming.
When you’re managing just one ad account, you may feel unsure if what you’re seeing in your campaigns is normal or not. And if you’re just starting out with Facebook ads, you may not know what to expect or what your target metrics should be.
At Biddyco, we work with many ecommerce companies, which gives us a broad perspective on what’s working and what’s not for a variety of brands. That’s why, in this article, we’re pulling back the curtain on our Facebook advertising data and giving you a better idea of the larger social advertising landscape.
Ad data from 20+ e-commerce brands and millions of dollars in spend
Last year, we worked with over 20 e-commerce brands to optimise their Facebook ads. This article is a general rollup of all of those campaigns into one so that we can share some high-level benchmarks.
Of course, every business, price point, and target market is different, but this data will give you a general average of what our clients’ numbers looked like across the board.
Cost per purchase
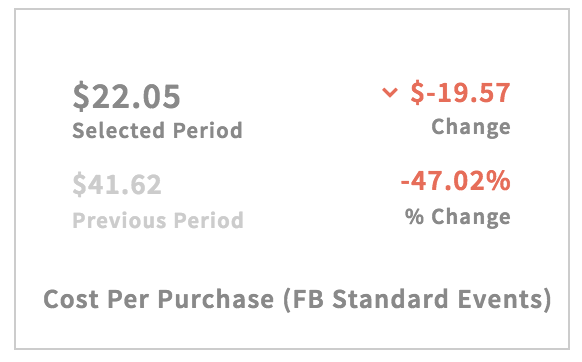 Cost per purchase is a measure of how much you have to spend for a customer to place an order on your site. It’s calculated by dividing your ad spend by your number of orders from ads. You’ll often hear this abbreviated as CPA, for cost per acquisition.
In the above example, our cost per purchase for 2017 was $22. Meaning, on average, our clients paid $22 to get a customer to come to their site and place an order.
This is generally considered a fantastic price to acquire paying customers.
Depending on your price point and margins, a $22 CPA could either be cost-prohibitive for your business, or it could be an affordable way to take your business to the next level. We’ve had clients all across the board. Some have needed a $9 CPA to be profitable, while others were thrilled with a $150 CPA.
CPA by month
While a $22 CPA for the whole year gives you a nice benchmark, that doesn’t necessarily paint a clear picture from month to month. And like most ecommerce brands, you likely have some aspect of seasonality, with Q4 being huge.
Below, you’ll see how our CPA changed throughout the year:
 We see higher CPAs in the first half of the year. Costs then start to drop towards the end as consumer demand picks up and holiday shopping starts.
So if you’re seeing lower demand and higher CPAs in Q1 and Q2, rest assured you aren’t the only one!
Return on ad spend
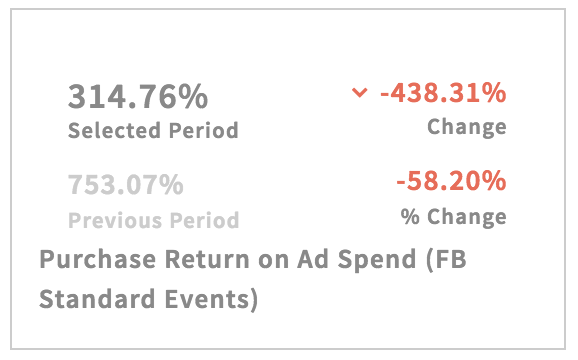 Return on ad spend (ROAS) is a measure of how much money you made from your investment in ads. If you spent $1 on ads and got back $3 in revenue, your ROAS would be 3x or 300%.
Our 2017 ROAS was over 3.14x, compared to 7x in 2016.
You’re probably thinking, 7x looks a lot better than 3.14x, so returns have gone way down.
At face value, that’s right. However, in 2017, we were able to significantly scale ad spend and ultimately made our clients significantly more profit. A higher ad spend is typically going to impact your ROAS, so don’t panic while trying to scale!
If you’re seeing about a 3x ROAS at a meaningful amount of spend, that’s normal, based on our work with different brands, price points, and industries.
CPM and CPC
 CPM (cost per thousand impressions) is a measure of the cost to get 1,000 impressions on an ad platform. CPC (cost per click) measures the cost to have someone click your ad and go to your website.
When it comes to CPCs and CPMs, there’s a clear trend of prices rising on both Facebook and Google overall. We can see that CPMs nearly doubled from 2016 to 2017, and the overall CPC went up 56%.
Here’s why: as more and more advertisers join these platforms, the demand for ad space increases. But there’s only so much ad inventory available. If Facebook starts making every other post in your feed an ad, it will drive users away. This leads to a delicate balancing act of maximising revenue while minimising user annoyance.
The CPCs are rising for the same reason a house in my LA neighborhood costs double what it did 5 years ago: limited supply and increasing demand.
As an ecommerce brand, you’ll need to get used to paying more to drive traffic to your site as these platforms get more and more competitive. And you’ll need to ensure that your ad content is engaging enough to compete within the newsfeed.
But just because the CPCs or CPMs rise does not mean that Facebook ads are a lost cause. You’ll see why below.
Conversion rate
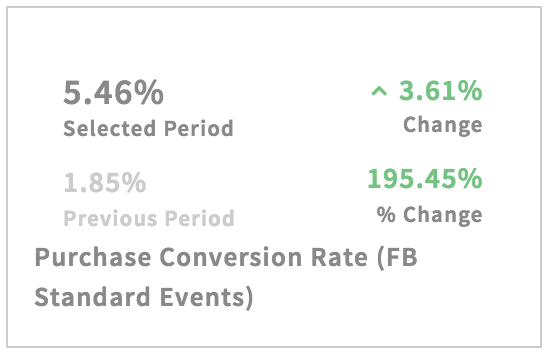 Last year, we saw an overall conversion rate of over 5%.This means that for every 100 people going to a site, five pulled out their credit card and bought something. That’s pretty incredible.
But as you’ll see from the month by month breakdown, that’s a little deceiving — it wasn’t a consistent 5% all year.
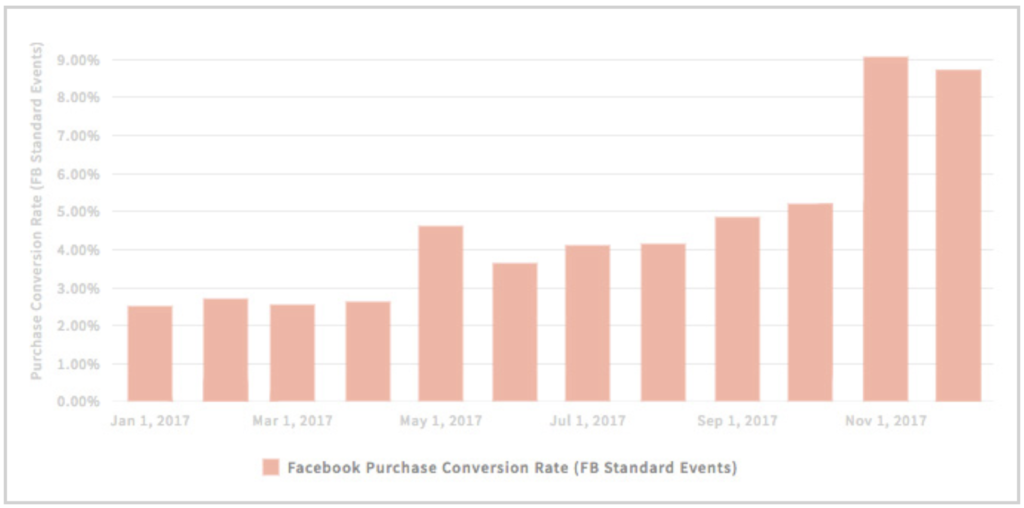 January through April were well below a 3% conversion rate, while November and December were above 8%. This causes our total year average to be around 5%.
eCommerce Fuel reported that 2017 conversion rates were up 25%, putting it at a 2.6% conversion rate overall.
Hopefully, you’re seeing at least a 2% conversion rate. Any less can make it hard to scale paid social advertising. But if you’re in the 2 to 5% range, you should be well on your way.
What all these numbers mean
So, yes, ad network costs increased substantially last year and will continue to do so for the foreseeable future. However, despite CPMs/CPCs increasing in 2017, overall returns and profit from ads were the best they’ve ever been for our clients.
That’s due to being able to find more targeted audiences and create more compelling ad creative to increase conversion rates and scale ad spend.
How to get numbers like these
Benchmarks are great, but you’re probably scratching your head wondering, “How do I achieve results like these?”
There are a few common fundamentals we see among successful ecommerce advertisers:
- Use video ads: Video is king on Facebook. We consistently see video ads outperform still images. Video can be intimidating, but your video ads don’t necessarily have to have high production value. We’ve seen basic iPhone videos perform great!
- Increase your average order value: The more revenue you get per order, the more profitable your ad campaigns will be. If you sell on Shopify, we recommend checking out apps like Product Upsell or CartHook to increase your average order value.
- Increase your conversion rate: Increasing your conversion rate has a dramatic impact on the performance of your ad campaigns. Adding social commerce techniques like social proof, customer reviews, and 2-day shipping all help.
- Patience: Facebook ads are rarely profitable right off the bat. You need to approach your campaigns knowing that Facebook is not a magic ATM, and will require time to get going and become profitable.
Get updated numbers each month
If you found this helpful and would like to receive a similar report each month tracking the above metrics so that you always have the most up to date benchmarks, click here to get our monthly research report.
Learn more
Interested in learning more about ShipBob? Request a quote below to connect with a member of the ShipBob team.
