
Economic Order Quantity: How EOQ Can Help You Minimise Costs & Save Space
Skip the Scroll — Download the PDF
Download this blog as a PDF to revisit it whenever you want. We’ll email you a copy.
Table of Contents
** Minutes
What is economic order quantity (EOQ)?
Economic order quantity formula walkthrough
Economic order quantity calculator
Limitations & challenges of the EOQ model
Other factors that can optimise inventory
When reordering products, many businesses place orders based on what they need at the exact moment. Instead, they should optimise the way they order and pay for products by using the Economic Order Quantity formula (EOQ).
The EOQ formula helps calculate the optimal order quantity to save money on logistics and ecommerce warehousing costs. By calculating EOQ, you’re able to make better decisions on how much product to order in a given period of time.
What is economic order quantity (EOQ)
Economic order quantity is a calculation companies use to figure out the optimal number of inventory units to order, with the goal to minimise the logistics costs, warehousing space, stockouts, and overstock costs. The goal of the EOQ model is to determine the ideal quantity of units for an order that enables you to meet demand without over- or under-stocking.
Why you should calculate EOQ (+ use case examples)
Minimise inventory costs & stockouts
Having extra items in your inventory can quickly increase storage costs. Inventory costs can also go up depending on how you order, what gets damaged, and what products never sell. If you’re constantly re-ordering products that have low velocity, EOQ can help determine how much to order in a certain time period.
By calculating how much you need based on how much you sell in a given period of time, you can also avoid stockouts without keeping too much inventory on hand for too long. Perhaps you’ll discover that ordering in smaller quantities is more cost-effective for your business, or perhaps it’s cheaper to order in bulk. Either way, you won’t know unless you calculate your EOQ.

Navigate seasonal demand shifts
If demand for your brand’s products fluctuates with the seasons, calculating your EOQ for each season can help you balance inventory all year round.
Scale efficiently
By leveraging the EOQ formula, you can keep just enough inventory on hand to meet demand without getting bogged down by excess stock or deadstock. This makes it much easier for your brand to scale its inventory, fulfilment, and shipping operations, both into new channels and into new demographics and global locations.
Women’s health and wellness brand Bloom Nutrition, for example, has leveraged ShipBob’s analytics dashboard to gain visibility into data like EOQs and inventory levels at different locations as they have added new retail partnerships and expanded into new countries. With ShipBob supporting their fulfilment, Bloom has scaled into a 9-figure brand – and shows no signs of slowing down.
“As you grow your business, nice-to-haves quickly becomes must-haves – especially when it comes to data and reporting.ShipBob’s dashboard provides us deep visibility into those crucial metrics for inventory, fulfilment, and shipping. It has been phenomenal.
With the real-time data we see in our ShipBob dashboard, we can glean insights that tell us which levers to pull and what our costs are across channels, so that we don’t get any surprises on our monthly income statements. Those insights and the reporting that ShipBob offers are definitely a must-have for our business.”
Neil Blewitt, SVP of Operations at Bloom Nutrition



Economic order quantity formula + example
The EOQ formula is made up of three variables:
- Holding costs (per year, per unit) — abbreviated “H”
- Demand rate (quantity sold per year) — abbreviated “D”
- Setup costs (per order, generally including shipping and handling) — abbreviated “S”
Using these variables, the formula for economic order quantity is:
EOQ = √ [ (2 x S x D) / H]
Let’s break down each variable component and go through an example calculation.
Holding costs (H)
Holding cost (also known as carrying costs) refers to the total cost of holding inventory. How much do you spend on holding and storing inventory, per unit, per year? In order to properly calculate EOQ, you’ll first need to determine your holding cost.
To calculate your holding costs, use the following formula:
Holding Cost = (Storage Costs + Employee Salaries + Opportunity Costs + Depreciation Costs) / Total Value of Annual Inventory
Demand rate (D)
How much demand do you get for a product each year? By looking into historical order data as well as, sales data, you can determine the number of units you sell year over year.
Setup costs (S)
Also referred to as “order cost,” set up costs refer to how much a purchase order costs. This is done on a per-order basis and includes both the shipping and handling costs.
An EOQ example
Let’s say your brand wants to calculate its economic order quantity for it’s most popular product: a vanilla-scented candle. You do some research, and determine that:
- Your holding cost is $0.75 per unit
- Your demand rate is 10,000 units per year
- Your setup cost is $500
Next, you should plug these variables into the EOQ formula, and perform the calculation like so:
EOQ = √ [(2 x 500 x 10,000) / .75]
EOQ = √ [10,000,000 / .75]
EOQ = √ 13,333,333.33
EOQ = 3,652 units per order
This means that the optimal number of inventory units for your brand to purchase in a given restocking order is 3,652 units.
Economic order quantity calculator
Other factors that can optimise inventory
Things like seasonality or big sales can also affect your inventory accuracy. In addition to EOQ, there are a few other ways to optimise inventory.
Reorder points
Instead of manually checking inventory levels to reorder products, you can set automatic reorder points that automatically place an order once your inventory levels hit a certain threshold. Investing in an inventory management software or partnering with a 3PL) makes this easy to do.
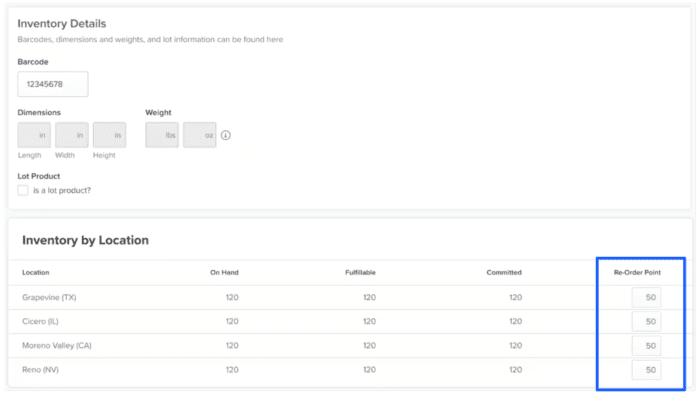
Safety stock measurements
There are times when demand can increase suddenly or there are issues with a supplier that can prevent you from having enough inventory. Safety stock is simply extra inventory beyond the expected demand. Safety stock is also often used during busy shopping seasons like the holidays or during a big promotion or flash sale.
Real-time inventory tracking
Easily monitor your and control stock levels and know where products are stored in your warehouse by tracking inventory in real-time. That way, you know how much product can be shipped now, make faster inventory ordering decisions, and communicate any delays of out-of-stock items quickly.
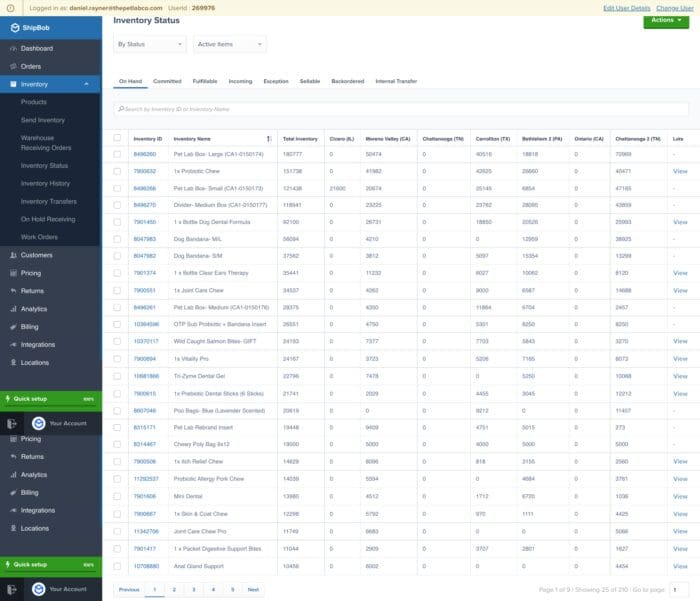
Take the guesswork out of EOQ with ShipBob
Using EOQ to balance your inventory can be challenging, but logistics partners like ShipBob can take some of the heavy lifting off your plate.
ShipBob provides warehousing and many inbound and outbound logistics services for thousands of ecommerce merchants. We offer affordable 2-day shipping, a global network of dozens of fulfilment centre locations, and best-in-class fulfilment technology. If you outsource warehousing and logistics to ShipBob, you get access to the coast-to-coast infrastructure, real-time data and analytics, and professional expertise you need to make inventory management easier.
Only pay for the storage that you need
ShipBob helps you reduce your inventory costs by allowing you to only pay for the space you need in our warehouses. You can quickly view storage costs over time through your ShipBob dashboard for full transparency.
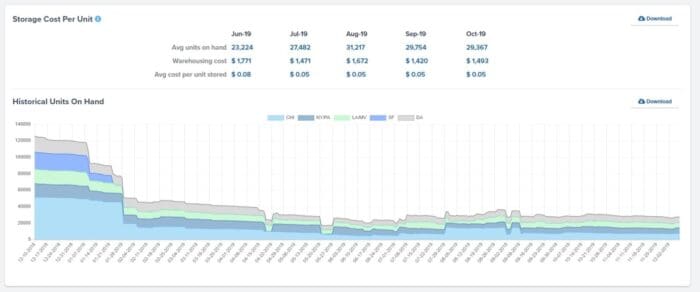
By distributing inventory across our extensive fulfilment centre network, you’ll also be able to save on shipping costs, reduce transit times, and improve your overall logistics and fulfilment strategy.
ShipBob even offers an Ideal Inventory Distribution tool to help you calculate the most strategic allocation of inventory across our network – and by leveraging our Inventory Placement Program, merchants can trust ShipBob to physically split their inventory for them.
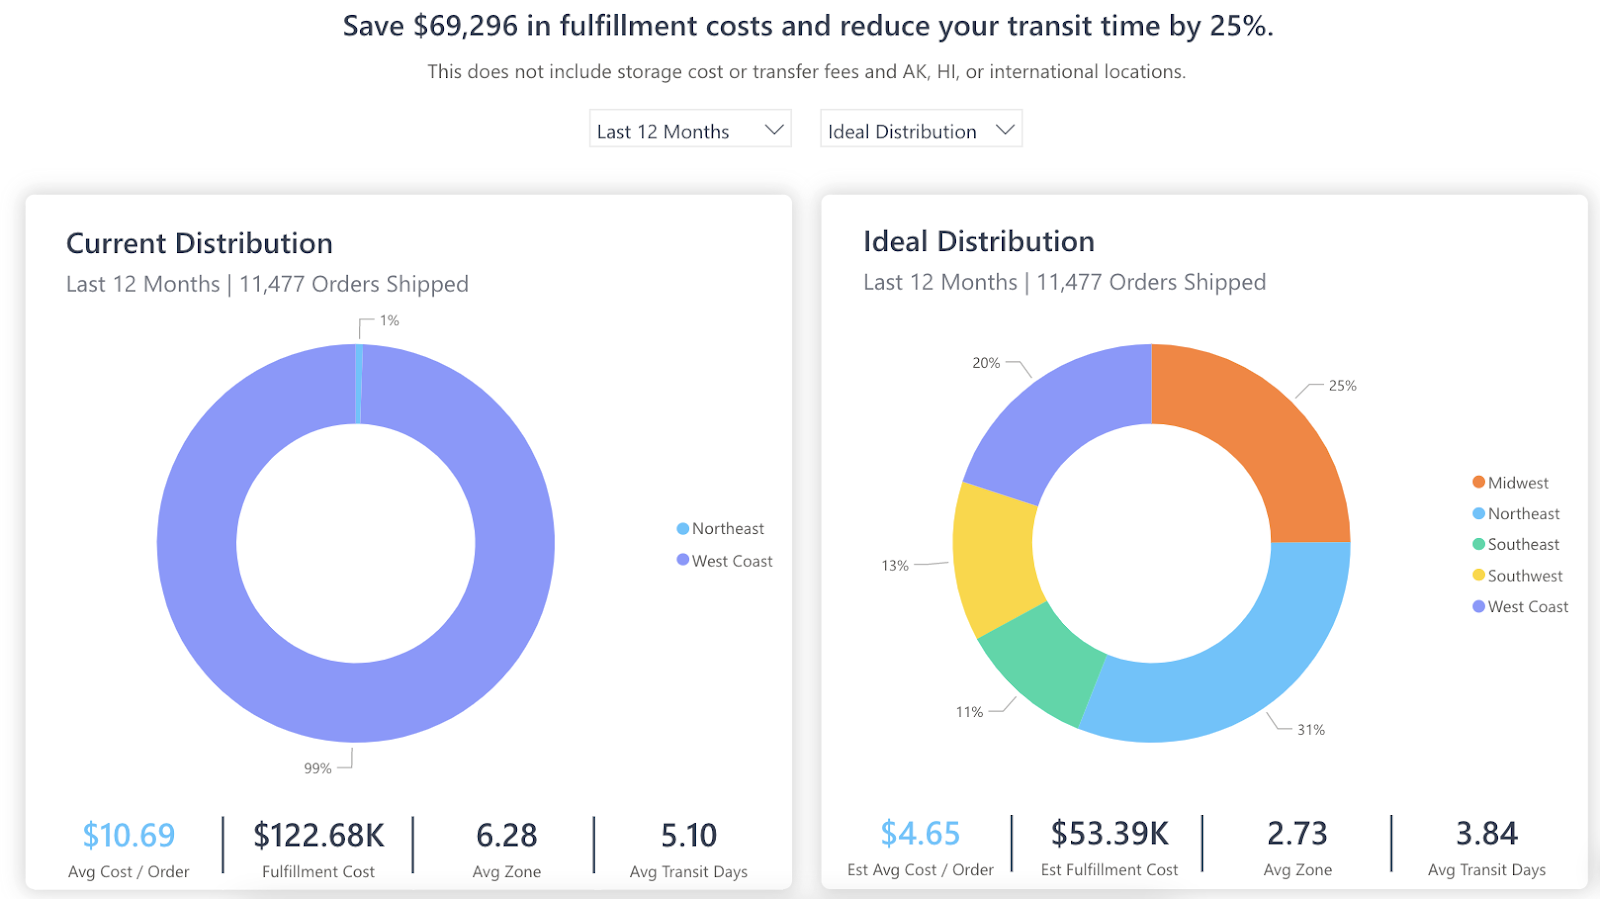
Reorder inventory on time
ShipBob’s best-in-class fulfilment technology offers built-in inventory management software, which helps you improve your inventory control. You can check inventory counts in real-time, set automatic reorder points, and better forecast demand.
Gain insights to help your business improve
ShipBob’s analytics dashboard exists to help you make better ecommerce inventory decisions. Brands like Baby Doppler leverage ShipBob’s data to get real-time insight into how much inventory to allocate to a specific warehouse, our current on-hand inventory levels, and how long each SKU is going to last by location.
“I can literally go into my ShipBob dashboard and see exactly what I want to see with a few clicks. I love that it’s a quick snapshot of everything that’s going on. I can literally not look at the ShipBob platform for 3 weeks, and then log in and within 10 minutes of analising the data, I know exactly where we stand in the business.
Even if I had to crunch some numbers, it would be just pulling a couple of reports and putting that data together – it’s so much easier than other solutions. As a person who relies on data analytics to run my business, I want to see my analytics exactly how ShipBob displays them to me.”
Mithu Kuna, Founder and CEO of Baby Doppler
Click the button below to learn more about how ShipBob can help your brand optimise inventory management.
Economic order quantity FAQs
Here are some of the most common questions about the economic order quantity (EOQ) formula:
What is EOQ and its formula?
Also referred to as ‘optimum lot size,’ the economic order quantity (or “EOQ”) is a calculation designed to find the optimal order quantity for businesses to minimise logistics costs, warehousing space, stockouts, and overstock costs.
To calculate the economic order quantity, you will need to know your brand’s demand rate, setup costs, and holding costs.
The formula is: EOQ = √ [ (2 x S x D) / H]
S = Setup costs
D = Demand rate
H = Holding costs
What is an example of economic order quantity?
Say your brand wanted to calculate EOQ for one of its best-selling products. You determine that:
- Your holding cost is $0.75 per unit
- Your demand rate is 10,000 units per year
- Your setup cost is $500
Next, you should plug these variables into the EOQ formula, and perform the calculation like so:
EOQ = √ [(2 x 500 x 10,000) / .75] = 3,652 units.
What companies use economic order quantity?
The economic order quantity formula can be used by any business that manages and stores inventory, including both brick-and-mortar retailers and ecommerce brands.
How does the economic order quantity model improve inventory management?
By calculating the economic order quantity for a SKU, a business can determine the ideal number of units that they should purchase – the amount that will enable them to meet expected customer demand without spending too much on holding costs or ending up with excess stock.
This, in turn, helps a business balance their inventory levels, recoup as much ROI on inventory as possible, and minimise deadstock and storage costs.
What are the assumptions of economic order quantity?
The economic order quantity formula assumes consistent demand, fixed costs, and the absence of other external factors that may impact demand, holding costs, or setup costs.
