
Inventory Weighted Average Cost: What You Need To Know (+ Methods & Formulas)
Skip the Scroll — Download the PDF
Download this blog as a PDF to revisit it whenever you want. We’ll email you a copy.
Table of Contents
** Minutes
What is the inventory weighted average?
How to calculate inventory weighted average cost
Comparing WAC to other common inventory valuation methods
What are the advantages of the inventory weighted average method?
It’s hard to determine if you’re going to reach revenue goals if you don’t know much your inventory is worth. For ecommerce businesses, keeping track of inventory and its value is crucial. By choosing the right inventory tracking method, you can better manage your ecommerce inventory and forecast potential profit.
Since so many variables play into determining the value of inventory (e.g., manufacturing costs, product demand, cost of goods sold (COGS), etc.), knowing the current worth of your inventory can seem like a moving target. Fortunately, there are several inventory valuation methods used in ecommerce that make the process easier. One of the most popular methods for ecommerce businesses is weighted average cost (WAC).
In this post, we’ll go over how to calculate WAC, how this method compares to other inventory valuations methods, and how properly tracking inventory can improve your bottom line.
What is the inventory weighted average?
Inventory weighted average (also known as ‘weighted average cost’) is one of the four most common inventory valuation methods used in ecommerce accounting.
This method uses a weighted average to determine the amount of money that goes into COGS and inventory by finding the average cost of each piece of available inventory.
The inventory weighted average method is recognised as valid by both GAAP and IFRS, but does require detailed calculations using a formula and accurate inventory data.
When is weighted average inventory cost used?
Weighted average cost is often used when it makes sense to assign the average cost of production to each unit of a given product. This includes when:
- Inventory items are identical to one another, or when it is difficult or impossible to assign a cost to an individual unit of inventory.
- A business experiences fast inventory turnover and regularly purchases or replenishes stock.
- It’s hard to differentiate between older and newer items.

How to calculate inventory weighted average cost
To calculate the weighted average cost, divide the total cost of goods purchased by the number of units available for sale. To find the cost of goods available for sale, you’ll need the total amount of beginning inventory and recent purchases. The final calculation will provide a weighted average value for every item available for sale.
Inventory weighted average cost formula (WAC)
To easily calculate WAC, use the simple formula as followed:
WAC = Cost of goods available for sale / Total number of units in inventory
Weighted average cost calculation example
Calculating the weighted average cost might seem complicated at first, but it’s simple once you get the hang of it. Here’s an example of how to calculate WAC:
| Purchases for July | Quantity | Cost per unit | Total cost |
| Beginning inventory (July 1) | 100 | $2.50 | $250 |
| July 6 | 300 | $2.75 | $825 |
| July 15 | 200 | $3.00 | $600 |
| July 20 | 500 | $2.50 | $1,250 |
| Ending inventory (July 31) | 1,100 units | $2.65 (average weighted cost) | $2,925 |
The total cost of the inventory purchased is $2,925. The total number of units in inventory is 1,100. To calculate the WAC, follow the formula as follows:
WAC = $2,925 / 1,100 units
WAC = $2.65 per unit
This is a simplified example of calculating weighted average cost. In actuality, your WAC calculations will be affected by the kind of inventory system you use.

Periodic inventory system
The periodic inventory system is an inventory valuation system in which inventory levels and COGS are not updated after every purchase or sale. Rather, these records are only updated periodically – usually at the end of a designated accounting period, such as a quarter or fiscal year.
Under the periodic inventory system, a brand would wait until the end of the accounting period to calculate the cost of goods available for sale and the total number of units in inventory.
For example, say a candle company uses the periodic system and updates its records quarterly. At the beginning of the first quarter (Jan 1 – March 31), they started out with 200 units of inventory, each of which cost $10 (for a total cost of $2,000). Throughout that quarter, they made the following purchases and sales:
Purchases:
- January 10 purchase of 400 units at a cost of $10 = $4,000
- February 16 purchase of 300 units at a cost of $12 = $3,600
- March 7 purchase of 175 units at a cost of $16 = $2,800
Sales:
- End of February sales of 350 units
- End of March sales of 125 units
The company would wait until the end of the quarter to calculate the cost of goods available for sale and the total number of units in inventory. At that point, their calculations would look like this:
Cost of goods available for sale = Ending inventory value + Cost of goods purchased
Cost of goods available for sale = $2,000 + $4,000 + $3,600 + $2,800
Cost of goods available for sale = $12,400
Total number of units in inventory = (Beginning Inventory + Purchased Inventory) – Sold Inventory
Total number of units in inventory = (200 + 400 + 300 + 175) – (350 + 125)
Total number of units in inventory = 1,075 – 475
Total number of units in inventory = 600
With this data, they would calculate WAC as follows:
WAC = $12,400 / 600
WAC = $20.66
Perpetual inventory system
The perpetual inventory system is an inventory valuation system in which inventory levels and COGS are updated after every purchase or sale. This system delivers more accurate real-time inventory counts, but makes calculating WAC a little trickier.
Under the perpetual inventory system, a brand determines the weighted average cost of each unit right before those units are sold, and uses that number to calculate a new COGs and ending inventory after the sale.
Let’s use the same example from above. Using the perpetual inventory system, the brand would calculate WAC at two different points: right after the February sale, and right after the March sale.
February sale
Cost of goods available for sale = $2,000 + $4,000 + $3,600
Cost of goods available for sale = $9,600
Total number of units in inventory = 200 + 400 + 300
Total number of units in inventory = 900
Total number of units in inventory = 900
WAC = $9,600 / 900
WAC = $10.66
At this point, the brand’s COGS and ending inventory would be:
COGS = Total sold in the period x WAC
COGS = 350 x $10.66
COGS = $3,731
Ending inventory = Cost of goods available for sale – COGS
Ending inventory = $9,600 – $3,731
Ending inventory = $5,869
March sale
When calculating WAC after the next sale in March, the company would use the ending inventory value from the last sale to calculate cost of goods available for sale:
Cost of goods available for sale = $5,869 + $2,800
Cost of goods available for sale = $8,669
Similarly, the company must factor in the February sale into its new total units in inventory:
Total number of units in inventory = (900 – 350) + 175
Total number of units in inventory = 550 + 175
Total number of units in inventory = 725
And would calculate WAC as such:
WAC = $8,669 / 725
WAC = $11.96
As a result, their COGS and Ending inventory would be:
COGS = 125 x $11.96
COGS = $1,495
Ending inventory = $8,669 – $1,495
Ending inventory = $7,174
Comparing WAC to other common inventory valuation methods
Weighted average cost is a great method to determine the value of your current inventory, but it doesn’t necessarily mean it’s the right method for your business. It’s important to choose a method that you will use consistently throughout the year.
To make sure you’re using the right method that makes the most sense for your business, it’s recommended that you weigh the pros and cons of each. If you switch methods before the next tax period, it will result in major discrepancies.
Before you choose weighted average cost as your method of choice, be sure to familiarize yourself with the three additional types of inventory valuation methods below and understand how they compare to the WAC formula.
FIFO (first-in, first-out)
The FIFO method assumes that the inventory produced first will be the first unit(s) to be sold and fulfilled. This method is best for perishables, or products that have a shorter shelf life or become obsolete.
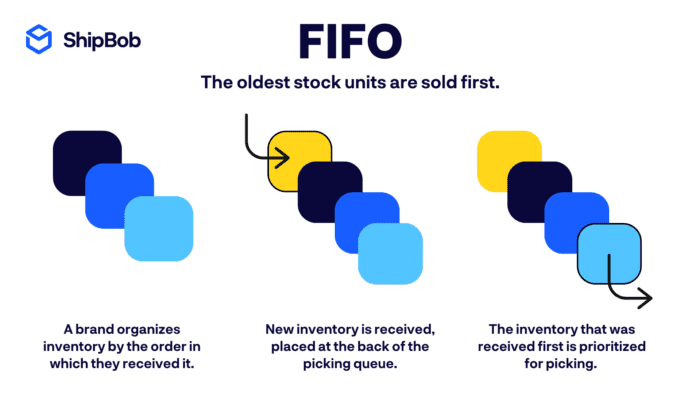
The downfall of this method is that if product costs significantly increase and your accountant is using value amounts from months ago, it can negatively impact profits or be misrepresented on an income statement.
LIFO (last-in, last-out)
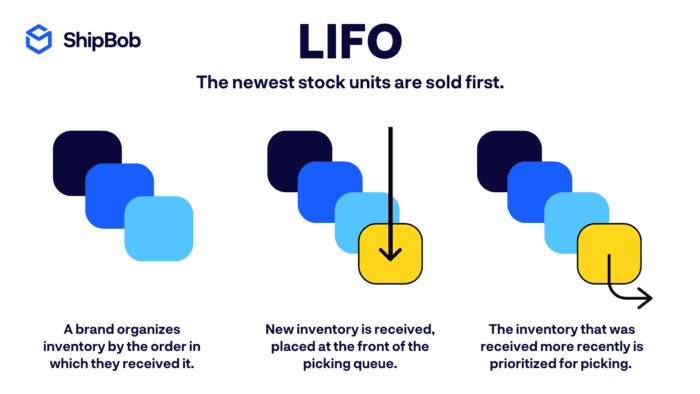
The LIFO method records the most recently purchased products in the inventory as sold first, and the lower cost of older products will be reported as inventory. During times of inflation, LIFO results in higher COGS and a lower balance of remaining inventory.
Specific identification method
The specific identification method provides the most accurate unit cost since it tracks every single item in stock individually from the time it arrives to when it is sold. This is a common method for small businesses and startups that can keep up with tracking every item in inventory, but it’s not a realistic approach for large businesses.
WAC
Compared to the other common inventory valuation methods, WAC is the ideal method for direct-to-consumer brands that have a high volume of inventory with items that are similar in cost. For example, if you sell different scents of perfumes in the same size bottle, you might have several unique SKUs, but the value of each item is the same.
What are the advantages of the inventory weighted average method?
The inventory weighted average method is one of the most common inventory valuation methods because of the many benefits that it offers, such as time savings and consistency. Here are some of the advantages of using WAC in your overall inventory management process.
1. Easily track inventory value
Keeping up with inventory counts is one thing, let alone tracking the costs it takes to purchase and store inventory. Unlike FIFO and LIFO that use a range of costs, the WAC method uses a blended average, making it easier to calculate and track inventory value.
2. Less paperwork for you
The WAC method requires a single cost calculation to determine the average value of all items in stock. Since every item is valued at the same amount, there is no need to maintain detailed inventory purchasing records, which means less paperwork to keep track of.
3. Cut overall costs
The cost of managing your inventory can cut into profits if you don’t take the time to optimise the process. Instead of counting up each sellable unit and then adding up the value of each product, the WAC formula provides a time-saving alternative to calculate current inventory value, which helps you save money in the long run.
Other ways to simplify your process and reduce the costs associated with managing inventory are to use inventory management software and/or partner with a third-party logistics (3PL) company that provides inventory management tools, ecommerce warehousing, and real-time inventory reports. By optimising your inventory management process and reorder quantity, you can reduce human error, spend less on labour, and save on inventory carrying costs. Additionally, you can bolster your warehousing operations with awarehouse management system (WMS) for top-notch efficiency.
“I felt like I couldn’t grow until I moved to ShipBob. Our old 3PL was slowing us down. Now I am encouraged to sell more with them. My CPA even said to me, ‘thank God you switched to ShipBob. ShipBob provides me clarity and insight to help me make business decisions when I need it, along with responsive customer support.”
Courtney Lee, founder of Prymal
How outsourcing inventory management allows you to scale
By using the inventory weighted average cost method, you can track the value of inventory year over year for proper inventory accounting while saving time doing so. But there’s a lot more that goes into inventory management than keeping tracking of value.
Inventory management and order fulfilment become more complicated as ecommerce businesses grow. Without finding ways to optimise the supply chain and consistently track inventory and its value, it can be a challenge to scale.
Outsourcing fulfilment to a 3PL like ShipBob that offers inventory management services, analytics, and technology can help you scale faster. By partnering with ShipBob, you can focus your time on expanding your business and improving the customer experience, while we take care of fulfilment and inventory management tasks for you.
Access real-time analytics at a glance
ShipBob’s platform lets merchants manage their inventory through one streamlined, intuitive dashboard. This dashboard delivers real-time data inventory counts at the SKU level, so you can know exactly how much inventory you have, where it is, and how it’s moving.
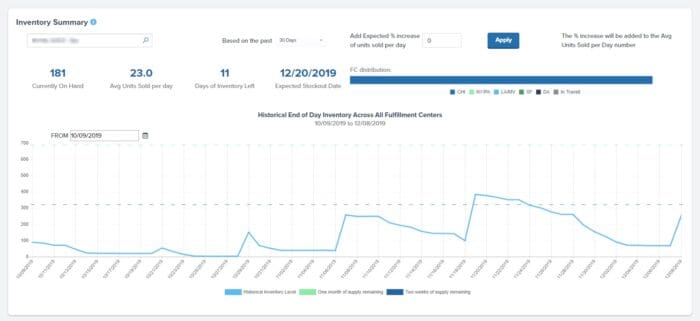
It also features built-in inventory analytics to automatically track key metrics, like SKU velocity, on-hand inventory, and storage costs. With these insights at your fingertips, you are better equipped to forcast demand, time replenishment, and more.
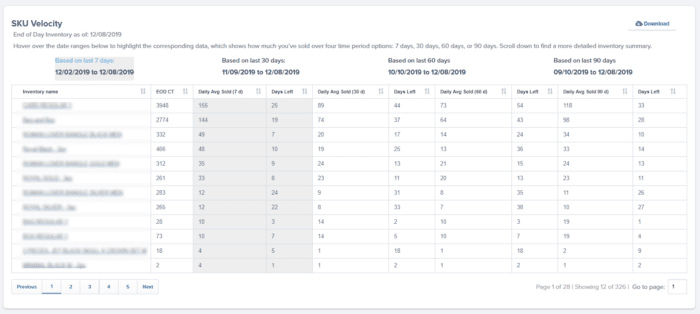
“I can literally go into my ShipBob dashboard and see exactly what I want to see with a few clicks. I love that it’s a quick snapshot of everything that’s going on. I can literally not look at the ShipBob platform for 3 weeks, and then log in and within 10 minutes of analising the data, I know exactly where we stand in the business.
Even if I had to crunch some numbers, it would be just pulling a couple of reports and putting that data together – it’s so much easier than other solutions. As a person who relies on data analytics to run my business, I want to see my analytics exactly how ShipBob displays them to me.”
Mithu Kuna, Founder and CEO of Baby Doppler
Unlock picking, packing, and kitting
While you’re focused on managing your inventory, let our teams of experts handle daily fulfilment and shipping logistics for you.
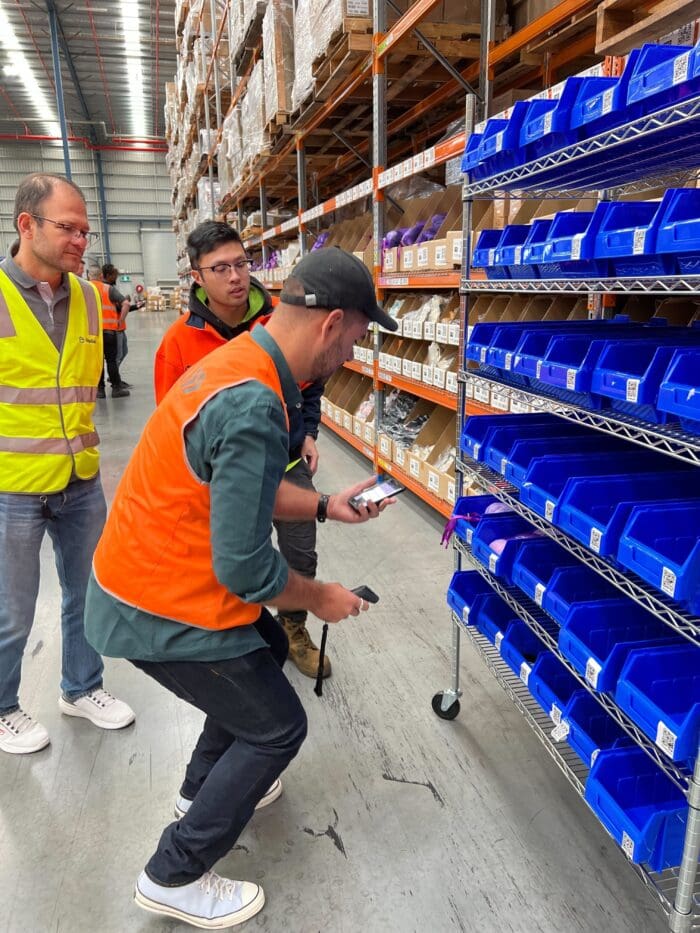
In addition to storing your inventory, our fulfilment teams will pick, pack, and ship your orders quickly and accurately. ShipBob also offers value-added services like kitting, assembly, and order customisation capabilities to help you create unforgettable unboxing experiences.

Leverage a global distribution network
As your customer base grows, you can use ShipBob’s fulfilment centre network to place inventory closer to customers. By storing and fulfilling orders from ShipBob’s dozens of fulfilment centres across the US, your brand can reduce both lead times and shipping costs to better meet customer expectations.
ShipBob merchants can even leverage our ideal inventory distribution tool to calculate the optimal allocation of inventory across ShipBob’s network.
“In addition to cost-savings from improved accuracy, I’ve also enjoyed lower shipping and freight costs because of ShipBob’s distribution network. ShipBob has dozens of fulfilment centres across the US, on both coasts and in the Midwest. By storing my inventory in fulfilment centres that are close to my retailer’s distribution centres, we minimise our shipping costs while improving transit times.”
Nadine Joseph, Founder & CEO of Peak and Valley
Achieve omnichannel inventory visibility
ShipBob’s solution is designed to keep inventory management simple, even as your brand grows.
Our dashboard integrates with dozens of major ecommerce platforms and marketplaces, so that you don’t have to switch inventory or fulfilment solutions to tap into new sales channels. In fact, ShipBob lets you manage inventory across all your channels in one place, giving you visibility into your whole inventory without juggling multiple softwares or tools.

When you’re ready to grow internationally, ShipBob’s global network of fulfilment centres also enables your brand to scale overseas without as many cross-border complexities, and makes it easy to manage your inventory wherever you sell.
“Outsourcing both retail and DTC order fulfilment to ShipBob really just gave us the flexibility that we needed to effectively grow our business — not just the DTC segment, but the retail segment also. Honestly, it changed the game for us. So we were just thrilled that ShipBob has come to lead the way in providing fulfilment solutions for small to medium sized businesses like ours.”
Nathan Garrison, Co-Founder and CEO of Sharkbanz
To learn more about how ShipBob can help your business scale its inventory management, click the button below for pricing and more information.
Inventory Weighted Average FAQs
Here are answers to some of the most common questions about weighted average cost.
What is an example of a weighted average cost?
Weighted average cost is the average cost of each piece of available inventory. For example, if a brand spent $3,000 to make or procure every item in their available inventory, and they have a total of 150 units in their inventory, the weighted average cost of each unit would be $3,000 divided by 150, or $20.
What is the difference between weighted average and standard cost?
The standard cost method of inventory valuation assigns a fixed price to every unit of inventory, and uses that price to determine inventory cost.
The weighted average cost method, on the other hand, take into account both the cost of available goods and the amount of available inventory at a particular moment in time.
What are the advantages of weighted average cost?
Weighted average cost lets you assign the average cost of production to each unit of a given product. This can help you easily track inventory valuation, minimise paperwork, and even cut costs.
What is the formula for weighted average?
The formula for weighted average cost is:
WAC = Cost of goods available for sale / Total number of units in inventory
What is the average cost of a product with higher costs for some units and lower costs for others?
When calculating average cost, you should factor in varying costs on the product level.
For instance, say a candle brand has $500 worth of inventory in stock. The brand purchases 100 units of a candle over the course of the quarter, but the price changes partway through and they end up purchasing 25 units for $2 apiece ($50) and 75 units for $4 apiece ($300).
In this case, the brand would calculate weighted average cost like this:
WAC = ($300 + $50) / 500 + 100
WAC = $350 / 600
WAC = $0.58
What is the difference between FIFO, LIFO, and weighted average in inventory cost accounting?
The FIFO method assumes that the inventory produced first will be the first unit(s) to be sold and fulfilled.
The LIFO method assumes that the inventory that was purchased most recently will be the first to be sold and fulfilled.
The weighted average cost method of inventory valuation does not take into account when particular units are sold, as variations in price over time are worked into the calculation of the average and the average cost is used to determine COGS and inventory valuation.


%20-%20ShipBob%20UK&_biz_n=0&rnd=685775&cdn_o=a&_biz_z=1745647765292)
%20-%20ShipBob%20UK&rnd=781777&cdn_o=a&_biz_z=1745647765295)
%20-%20ShipBob%20UK&_biz_n=1&rnd=127558&cdn_o=a&_biz_z=1745647765457)
%20-%20ShipBob%20UK&_biz_n=2&rnd=113739&cdn_o=a&_biz_z=1745647765849)
%20-%20ShipBob%20UK&_biz_n=3&rnd=895758&cdn_o=a&_biz_z=1745647765850)